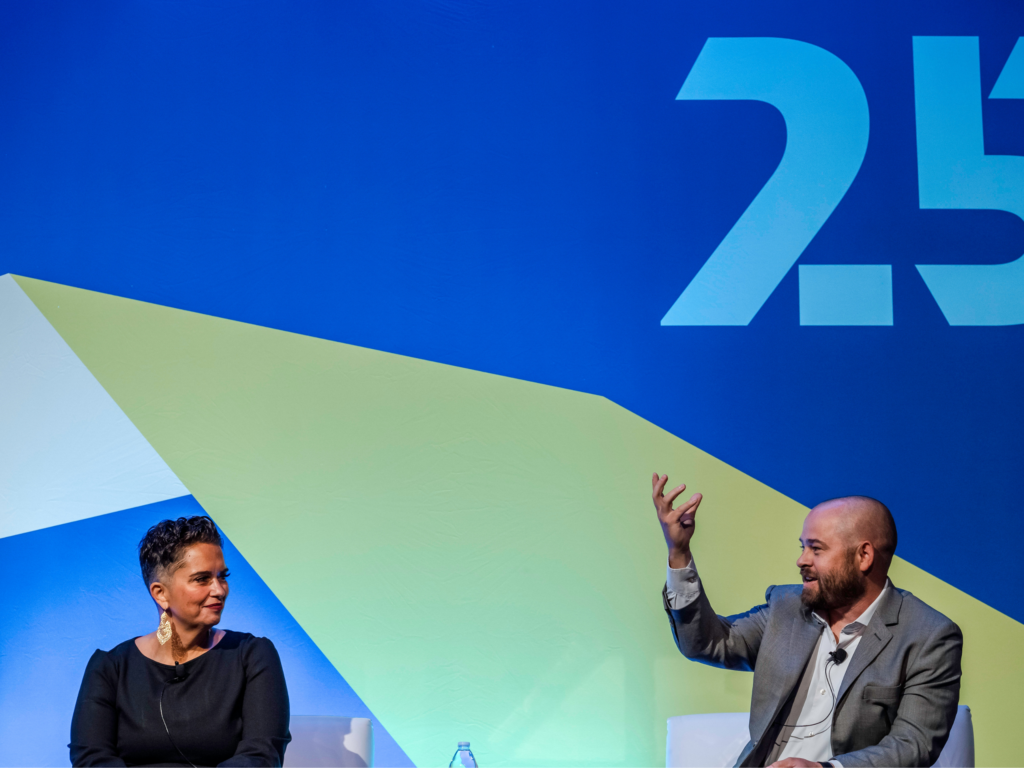
How to make the most of this moment? At NewSchools Summit 2010, one of the afternoon breakout sessions will focus on helping education entrepreneurs communicate effectively about their work and its impact. That means having a clear and compelling “message” or way of describing your organization, and bolstering that message with both compelling stories – about the ways childrens’ lives are changing as a result of entrepreneurial efforts – and hard numbers.
In Made to Stick: Why Some Ideas Survive and Others Die, authors Chip and Dan Heath share memorable anecdotes about stories that have made their way into the public discourse and stayed there – ranging from the kidney heist urban legend to the startling fat content of a tub of movie theater popcorn. And because we remember 50 percent of what we see and hear but only 10 percent of what we read, it’s important to include graphics, photos and video – though the real coup is figuring out how to get people to tell or teach others about your work, which drives their retention rate up to 95 percent.
Though there is some evidence to suggest that a story about a single affected person can be more persuasive to individual donors than a data-packed argument, numbers are incredibly important in helping to communicate the magnitude of the problem, and the scale and impact of a solution. Organizations like the Education Trust and The New Teacher Project have gathered and organized data about the achievement gap and teacher effectiveness, respectively, in ways that make the story easy to understand – and that often persuade policymakers and others to take action.

Of course, they know that it’s not just making numbers available that changes minds – they must be put in context, and made relevant for their audience. An increasing number of media outlets are experimenting with new ways of “data visualization” to help numbers tell stories to readers; during the 2008 presidential election, readers flocked to the New York Times infographics on poll and election results, while more recently, people are chattering about GOOD Magazine’s create-your-own-infographic contests. Meanwhile, a plethora of popular blogs have cropped up that are devoted to eye-catching illustrations of complex data sets.
Who in the entrepreneurial education community is doing a great job of explaining their work and its impact? What messages are getting through, and which are getting muddled? Do we have the data we need to make the case for entrepreneurs’ effectiveness – and if not, what information should we be collecting, and how? Weigh in here, and join the conversation at the NewSchools Summit on May 12.


