The use of data to influence decision-making isn’t new to K-12 education. In fact, given the sheer amount of paperwork, surveys and test scores generated, education has the potential to be one of, if not the, most data-driven sector in the U.S., but too often the data that teachers and administrators are saddled with is untimely or inactionable. We’re excited to see that change.
Over recent years, a slew of next generation data analytics tools are changing the way school leaders think about data by: making achievement data more actionable (e.g. BrightBytes, Schoolzilla), providing a more holistic portfolio of students’ performance (e.g. FreshGrade, Equal Opportunity Schools) and bringing more constituent voices to bear on learning (e.g. Panorama Education). To follow are several examples in which data tools are improving efficiency and equity in K-12.
Investment Approaches in Data
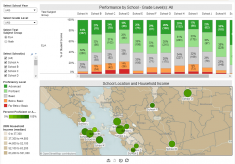
Making achievement data more actionable. The critical questions that K-12 school leaders want answered are rarely captured in a single data set. Data on interconnected issues such as student performance, behavior and attendance are typically housed in dozens of disparate legacy data systems that have limited functionality and lack integration. Schoolzilla addresses this problem by providing schools with a data warehousing platform that allows educators to connect and clean various data sources into intuitive, actionable visualizations. Once the data is connected, Schoolzilla creates customizable data dashboards enabling educators to focus on their key performance indicators as highlighted in this case study and pictured below. Schoolzilla can also help educators benchmark their school’s performance relative to other schools laying the groundwork for conversations around best practices.
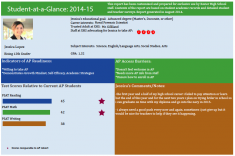
More holistic portfolio of student performance. While test scores are an important measure of student progress and allow school leaders to better understand achievement gaps, they only capture a limited component of a young person’s academic strengths and weaknesses. We are excited about data analytics tools that humanize and provide a more holistic profile of student capability and potential. A great example is Equal Opportunity Schools (EOS), an organization which partners with high school principals and district superintendents to increase enrollment and success of underrepresented students (e.g. low-income and minority) in a school’s most challenging classes (e.g. AP and IB). EOS makes their information actionable to school leaders by creating data-rich student profiles highlighting academic success and readiness for rigorous course content. EOS schools have dramatically increased the number of low-income and minority students in AP and IB classes while maintaining or improving exam passage rates for these courses.
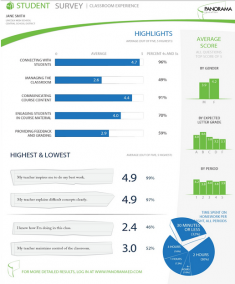
Elevating the student voice. Panorama Education, a Boston-based edtech company, is helping teachers collect and analyze student feedback. Panorama’s student survey reports are elevating the student voice and providing teachers with actionable analytics to understand where there’s opportunity to improve instruction and engagement. This is one of several examples in which data analytics tools are playing a positive role in impacting change at the point of instruction.
Venture Funding for Data Tools
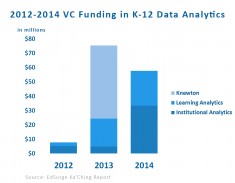
While a new generation of data analytics tools gain widespread adoption in schools, they’re also catching the eye of venture investors. According to K-12 edtech venture funding data provided by EdSurge, funding for data analytics tools has steadily grown in recent years – 2014 year-to-date venture funding is already up 687% from 2012 at $58M. For the sake of simplicity, we break data analytics edtech companies into two primary categories:
- Learning analytics: The use of data to inform and improve instruction and learning (e.g. Ellevation Education, Panorama Education).
- Institutional analytics: The use of data to make better decisions about how to improve operations at a school-wide or district level. (e.g. BrightBytes, LearnSprout).
The increased funding is driven by Series B funding rounds for MasteryConnect, BrightBytes, and Series A for Clever. The enthusiasm isn’t unwarranted – according to the McKinsey Global Institute, more open data practices in education have the opportunity to unlock economic value of $800bn to $1.2 trillion annually (this figure includes higher education). Per their analysis, the primary drivers of value include improved instructional outcomes by identifying more effective pedagogies and cost-savings through more efficient administration.
Looking Ahead
There are still a number of opportunities to more fully realize the potential of data analytics in education such as better privacy tools, greater levels of integration across a variety of systems and actionable data for parents. Data analytics will remain a prevalent storyline in edtech, particularly as states rollout the first generation of Common Core assessments in the 2014-2015 academic year. We expect and look forward to an influx of high-quality data tools that will help teachers and administrators answer pressing and challenging questions.
![Schoolzilla NWEA MAP Teacher Report 2 (drill-down)[1]](https://www.newschools.org/wp-content/uploads/Schoolzilla-NWEA-MAP-Teacher-Report-2-drill-down1-235x149.jpg)
